On a quiet afternoon at the Houston Open, three pros in the field posted ball-speed numbers on the range with a Titleist prototype driver that almost sounded too good to be true. Positioned behind Jeff Kang, Charley Hoffman, and Michael Brennan, I listened intently as they reported ball-speed gains of 1-3 mph with GTS. Kang even confirmed the increases were closer to 4-5 mph when he started warming up.
Was the launch monitor juiced? More than any other subset, professionals generally have the toughest time squeezing meaningful distance gains out of a new driver because every club in the bag is highly optimised.
When you’re already maxing out the driver, gaining an extra 10 yards, right around what you might expect to see with a 3-4 mph ball speed increase—sets off alarm bells.
Related: Titleist drivers: Crown defence
Sure, you could be hitting the weight room harder than ever. But the speed gains naturally raise questions about driver performance, especially when every manufacturer is bumping up against the speed ceiling.
According to Hoffman, the ball speed increase he saw was attributed to something other than a red-hot face.
“It’s a greener light for me,” he said. “If you know the off-centre hits are going to be more consistent, you have the intuition to swing harder at it because you’re not scared of the ball going offline.”
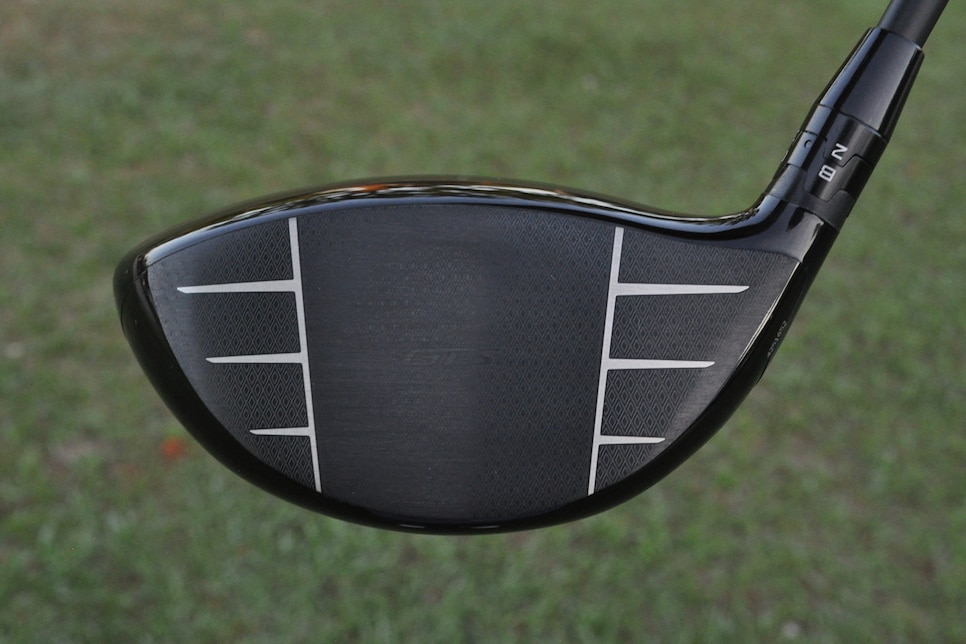
Hoffman’s revelation naturally led us to wonder how good the off-centre performance was from one cycle to the next, so we put GTS to the test on the Golf Laboratories swing robot in a head-to-head battle against GT to see if it was quantifiable.
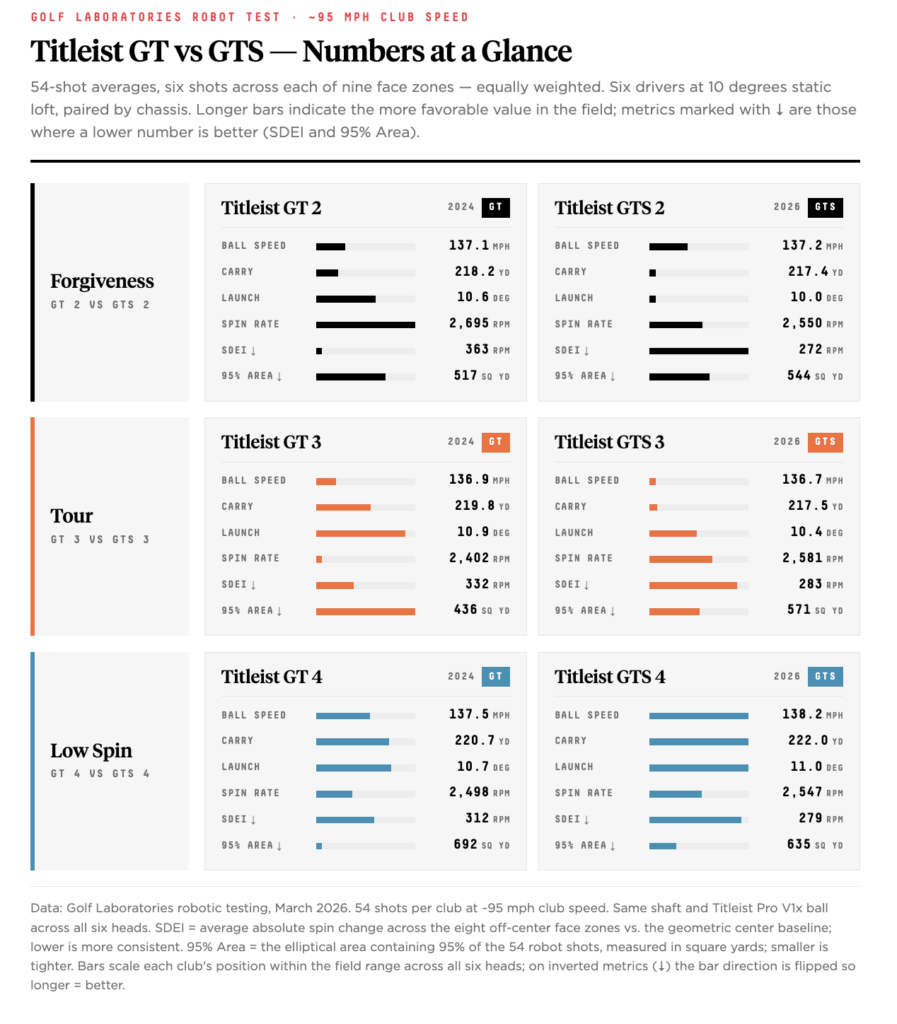
For the initial test, we ran the robot at 95 mph and impacted nine different locations on the face of the GT/GTS2, GT/GTS3, GT/GTS4 with the same neutral delivery and attack angle to establish a performance baseline.
While GTS wasn’t able to replicate the speed numbers pros saw in Houston—the robot can’t swing faster as it gains confidence on off-centre strikes—it found a meaningful improvement hiding somewhere a player won’t see on a launch monitor in 10 swings.
It’s the same area that allowed pros to gain distance by simply swapping out heads.
Start with spin
Spin is the metric that moves the most in this comparison, and it shifts in the correct direction if you’re in the business of designing better products.
Looking at the spin histograms across all 54 shots, the GTS lineup is doing the cleanest job of reducing the extremes. The GT2 saw 11 of 54 shots record a spin rate above 3,100 rpm, while the GTS2 saw only 5 shots. The high-spin tail has been reduced by half, which is good news for golfers with a negative angle of attack (AoA).
On the other end, the GT3 has a different problem. Fifteen of its 54 shots came in under 2,100 rpm. This is on the razor’s edge of playable spin for a majority of golfers. The GTS3 manages to cut the number of shots below 2,100 to a single recording strike. It’s more of the same on the GT4-to-GTS4 jump: 9 shots down to 2.
What that means in layman’s terms: the GTS face is sending more of its shots into the 2,400-3,000 rpm window that a 95-mph golfer wants to live in. The GT3 had 19 of 54 shots in that pocket. The GTS3 has 28. The GTS2 jumped from 24 to 29. Across the lineup, we’re seeing meaningful spin improve from nearly every impact location.

Launch under control
Launch consistency is the metric a player won’t feel on a single shot but absolutely feels over a round. If the head is launching the ball into the air at 9 degrees on one swing and 13 degrees on the next, your distance control will be affected—even more so if the wind is a factor.
The launch story is even cleaner than the spin story.
The 80-percent band, where 80 of every 100 shots fall, confirms launch angles are tightening as well, even on mishits. The GT2 launched across a 4.7-degree window, while the GTS2 comes in at 3.6. The GT3 recorded 4.7, compared to the GTS3 at 3.9. The GT4 recorded the widest range in the test at 5.8 degrees, and the GTS4 cut it to 3.7.

The biggest drop, by some margin, is on the low-spin head: 2.1 degrees of launch variability gone in a single product cycle.
For context on what that 2.1 degrees means, picture a fairway with a 220-yard layup line in front of a bunker. A driver that’s launching anywhere in a 5.8-degree window is going to send some shots over the bunker and some into it on the same swing. A 3.7-degree window keeps you on one side of the trouble. That’s the kind of thing that doesn’t show up on a ball speed graphic but shows up on the scorecard.
Improvements in launch and spin consistency aren’t the sexiest storylines, but both are hallmarks of a sound product line.
Where carry sits
As much as I continue to stump for spin and launch consistency translating to better golf, carry distribution continues to be the most important metric for golfers. Everyone wants something that’s longer than their current gamer.

The GT3 was already doing something special. Fifty-two of its 54 shots carried between 210 and 230 yards, the tightest 20-yard band in the entire test, and it’s two years old. During our robotic testing, the GTS3 wasn’t able to top it in a head-to-head battle, with forty-eight of 54 shots coming in a 209-to-229-yard window, plus one shot under 200 yards that the GT3 didn’t produce.
But outside of GT3, every GTS head pulled its own carry distribution tighter than the GT it replaced. The GT2 had 46 of 54 shots in its tightest 20-yard band. The GTS2 has 49. The GT4 had 47 of 54. The GTS4 has 48. More importantly, the GT4 sent six shots under 210 yards across its 54 swings. The GTS4 had a lone shot in the same range.
While you won’t see massive distance gains going from GT to GTS, the robot confirms the bad balls are being reduced in an effort to eliminate the round-cratering miss.
Mishit tax
The eight mishit zones tell their own version of the consistency story, and it’s worth looking at separately from the headline carry numbers.

The robot’s carry loss on a mishit, averaged across the eight off-centre zones versus the geometric centre, gives a single number that captures what a player gives back when impact moves around the face. Across the six clubs in the test, that number lands between 9.7 and 11.1 yards, and every GTS chassis brought it down from its GT predecessor. The GTS2 shaved a yard off the GT2’s 11-yard average; the GTS3 cut nearly a yard-and-a-half off the GT3; and the GTS4 trimmed the GT4 by roughly the same margin. It doesn’t sound like much on a single swing, but it can add up over the course of a round.
Where things start to diverge is when you analyse the worst-case mishit. The GTS2 pulled its worst-zone carry loss from a 25.4-yard hole down to 20.2, a 5-yard recovery on the kind of low-heel contact some 95-mph golfers make more often than they’d care to admit. The GTS4 same a similar improvement from 23.3 yards to 20.2. Again, these are incremental improvements we’re seeing across nearly every model
If there’s one model where performance went the wrong direction, it’s the low-spin offering. The GTS3’s worst-zone carry loss actually increased by nearly seven yards versus the GT3. A 95-mph golfer’s worst contact costs more on the new head than the old one, even though the rest of the eight-zone average improved. This is the dispersion-area regression showing up in a different lens.
However, the GTS3 has a single-zone improvement that’s worth highlighting, and it’s a noticeable one. The high-toe miss was a genuine soft spot on the GT3, with 16 yards of carry lost on a common impact location.
No head had a worse high-toe number during the test. With GTS3, the number was reduced under six yards, bringing the ball speed loss down by more than two mph, and pulling the launch and spin numbers back into a playable range. If you’re keeping track at home, that’s ten yards of recovery on a zone real golfers find.
Speed, kind of
Ball speed is one of the metrics many manufacturers tout during a new release. Speed sells. But in this case, the speed numbers were relatively flat across the board.
The GT2 averaged 137.1 mph, GTS2 averaged 137.2. GT3 averaged 136.9, GTS3 averaged 136.7. The GTS4 picked up less than 1 mph over the GT4.
What is interesting is what happens at the low end. Every 1 mph of ball speed lost is roughly 3 yards of carry, so a head that holds 137 mph on a mishit is going to carry the ball a lot farther than a head that drops to 132 on the same mishit. The GT3 had 13 of its 54 shots come in under 135 mph, while the GTS3, despite the lower headline number, ranged across a tighter speed window of 132.4 to 141.2 mph versus the GT3’s 131.2 to 142.0. It was more of the same with GTS4, which didn’t have a single shot under 134 mph across the 54 swings. The GT4, on the other hand, had 13 shots under 135.
Sure, the overall ball speed number isn’t changing drastically, but the lower end of the band is shifting up. That’s where the consistency story is hiding on this metric—not in the average, but in the floor.
The face story
The 95 percent dispersion area gets messy across this test, and it’s worth flagging what it does and doesn’t tell you.
For example, the total area on the GTS3 widened by 135 square yards when compared to GT3—the biggest dispersion regression recorded in the test. When any model sees an increase in dispersion, it inevitably leads to questions.
But when you split that area into its left-right component (lateral width) and its front-to-back component (depth), the GTS3 is actually tighter side-to-side than the GT3. The depth dimension is doing all of the area expansion.
With the GTS2, the trade-off goes the other way. The GTS2’s 95 percent area expanded by 27 square yards versus the GT2 because the lateral width grew from 21.2 yards to 26.6. The GT2 holds the tightest left-right pattern in the entire test, and the GTS2 walked some of that back to get the spin and launch consistency.

On the low-spin end of the spectrum, GTS4 cut total dispersion by 57 square yards and pulled the front-to-back depth in by about four yards while accepting two yards of additional left-right scatter. The improvements were minimal, but it’s the only GTS head in the test that cut total area outright.
Two things to take from that section: dispersion area is a single number that’s actually two metrics, and the GTS lineup gains live more in one of those metrics than the other.
Who should upgrade

If you’re in a GT2 right now, the GTS2 is worth strong consideration. The high-spin tail was reduced; the launch window tightened by a degree; and carry distribution got tighter. The lateral pattern widened slightly, but it widened from the tightest number in the test. The GTS2 is a different shape of forgiveness than the GT2, meaning it’s more consistent on launch and spin, but slightly less directional.
If you’re in a GT4, the GTS4 is also worth a look. It picked up ball speed, carry and tightened launch from 5.8 degrees of variability to 3.7. It also lifted the speed and carry floors, and cut dispersion area by 57 square yards. There isn’t a metric in the test where the GTS4 gave back performance to the GT4. The robot confirms this is the clearest year-over-year improvement in the test
Who should not upgrade
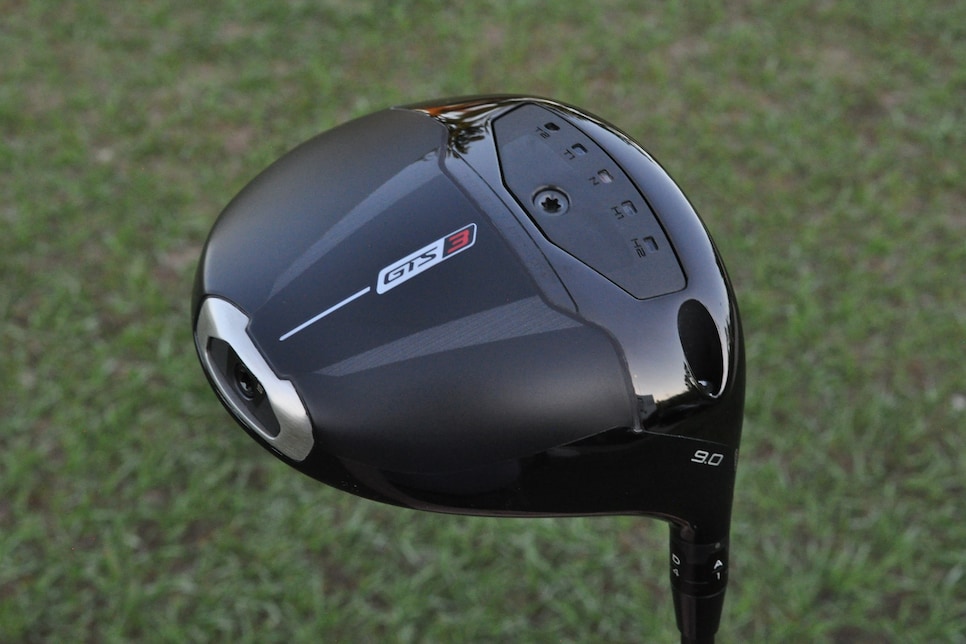
The GT3 is the most interesting case. It posts the tightest carry band in the test (52 of 54 shots in a 20-yard window) and the best total distance. The GTS3 did the work where the GT3 was weakest, reducing the number of spins below 2,100 and tightening the launch window.
The high-toe penalty was also improved by 10 yards. But the dispersion area widened by a third, and the carry distribution lost a tick.
The upgrade claim isn’t nearly as clear as GTS2 or GTS4, but there’s no question GTS3 is doing some things right that keep it in the upgrade conversation.