
Ping’s G400 lineup turns 9 years old this year, and like a fine wine, it has aged better than most in the driver category. Both the standard G400 and G400 Max heads continue to surface in tour bags, including 2025 Butterfield Bermuda Championship winner Adam Schenk.
While face technology has improved in the last decade, there’s a subset of gearheads who still believe G400 has what it takes to hang with Ping’s current G440. So we put the claim to the test.
For a new series we’re calling “Cult Classics,” the Golf Laboratories swing robot pitted G400 and G400 Max against G440 Max and G440 K to see how technology has evolved.
The robot hit 54 shots per club at roughly 95 mph across nine face zones, capturing how each head performs on a player’s best swings (center) and worst (heel, toe, high and low extremes).
The G400 lineup’s reputation holds up about as well as a tour player would tell you on the right kind of contact. But as we’ve seen with many of today’s most forgiving drivers, it’s what happens on a mishit that separates a good driver from a great driver.
Numbers at a glance Golf Laboratories Robot Test · ~95 MPH Club Speed Average Performance Across All 9 Face Zones 54-shot averages, 6 shots across each of 9 face zones — equally weighted. Ball speed, carry, total distance, launch angle and spin rate at ~95 mph club speed. Color bars show each club’s position within the field range. 2017 Lineup G400 2017 2017 Lineup Ball Speed 135.2mph Carry 213.7yds Total Distance 233.7yds Launch Angle 11.4° Spin Rate 3,007rpm G400 Max 2017 2017 Lineup Ball Speed 134.3mph Carry 215.2yds Total Distance 233.9yds Launch Angle 12.3° Spin Rate 2,800rpm 2025 Lineup G440 Max 2025 2025 Lineup Ball Speed 136.7mph Carry 221.4yds Total Distance 242.3yds Launch Angle 11.9° Spin Rate 2,613rpm G440 K 2025 2025 Lineup Ball Speed 136.5mph Carry 217.0yds Total Distance 238.3yds Launch Angle 11.6° Spin Rate 2,574rpm
There’s a version of this comparison where the G440 Max wins on every chart and the conversation ends there. That’s true on the headline averages: 221.4 yards of carry, 136.7 mph ball speed, the best total-distance number in the test. It’s exactly what you’d expect from a brand-new flagship against a lineup that has been around for almost a decade.
New face technology almost always beats older face technology. Few things in driver design are more reliable.
What’s harder to predict is how close the G400 Max gets to G440 in the performance department. Its 215.2-yard average is a yard-and-change ahead of the standard G400 and only six yards behind the G440 Max, a meaningful gap on paper, but small enough that a player whose miss pattern lives in the middle of the face won’t feel it on every hole.
On center contact specifically, the G400 Max comes within four yards of the G440 Max, and that single data point goes a long way toward explaining why the lineup has aged the way it has.
The G440 K is the one head in this test that doesn’t behave the way its averages suggest. Ball speed sits practically on top of the G440 Max, but carry comes in 4.4 yards lighter. Something is happening between impact and apex that the headline numbers can’t account for, and the heat map below is where it shows up.
Carry observations Ping Driver Carry Distance by Face Zone Carry Distance by Face Zone Average carry in yards across 9 face impact locations. 6 robot shots per zone · 54 shots per club · ~95 mph club speed. Heat map scale is consistent across all 4 clubs. Black outline = Mid Center baseline. Green = longest carry, red = shortest. Shorter 199.2 yds 228.3 yds Longer 2017 Lineup G400 2017 · 2017 Lineup 221.1Center 213.7Avg 203.5Min 17.6Max Loss HeelCenterToe 208.9 219.1 218.5 215.5 221.1 217.2 203.5 213.1 206.3 G400 Max 2017 · 2017 Lineup 224.1Center 215.2Avg 204.4Min 19.7Max Loss HeelCenterToe 204.7 221.8 220.2 213.6 224.1 221.2 204.4 216.1 210.9 2025 Lineup G440 Max 2025 · 2025 Lineup 227.9Center 221.4Avg 212.1Min 15.8Max Loss HeelCenterToe 216.8 225.2 224.7 221.8 227.9 225.9 212.1 222.0 216.1 G440 K 2025 · 2025 Lineup 226.7Center 217.0Avg 199.2Min 27.5Max Loss HeelCenterToe 209.1 224.2 223.6 211.3 226.7 228.3 199.2 217.2 213.6
The most useful thing the heat map does is separate “how far does this driver hit it” from “how far does this driver hit it when you don’t square it up.” Those are two different questions, and the G440 Max is the only head in the test that answers both the same way. Its weakest zone is still 212 yards, while its strongest is just under 228.
Move impact anywhere on the face and the ball goes roughly the same distance, which is the entire point of a max-forgiveness head, and another example of Ping delivering on the promise of mitigating mishits.
Interestingly enough, G440 K is the contradiction. It produces both the longest single-zone reading in the entire dataset (228.3 yards on the mid-toe) and the shortest (199.2 on the low-heel). That’s not a flaw so much as a personality. The K rewards golfers who tend to miss high and towards the toe. A fitting bay can tell pretty quickly which group a player belongs to, and the answer determines whether this head is the right one for the bag.
The G400 heads, predictably, are where nearly a decade of face technology becomes visible. Both produce a strike at the center that holds up in current company, but the perimeter gives back yardage in a way no new driver does anymore. That’s not a knock on the platform; it’s what 2017 face engineering looks like when you put it next to 2025 face engineering.
SDEI observations Ping Driver Spin Degradation Index SDEI — Spin Change vs. Center Baseline SDEI = average absolute spin change across 8 off-center face zones vs. Mid Center baseline. 6 robot shots per zone · 54 shots per club · ~95 mph club speed · Lower score = more consistent spin across the face. More stable 0 RPM Δ 685 RPM Δ Less stable 2017 Lineup G400 2017 · 2017 Lineup 317 RPM SDEI HeelCenterToe -275 -282 -450 -300 CTR +90 +176 +328 +634 G400 Max 2017 · 2017 Lineup 342 RPM SDEI HeelCenterToe +282 -285 -456 -68 CTR +120 +429 +413 +685 2025 Lineup G440 Max 2025 · 2025 Lineup 230 RPM SDEI HeelCenterToe -38 -227 -484 +8 CTR +24 +323 +231 +505 G440 K 2025 · 2025 Lineup 243 RPM SDEI HeelCenterToe +330 +117 -62 +123 CTR -20 +392 +324 +578
For those unfamiliar, our SDEI (Spin Degradation Index) metric is the average absolute spin change across the eight off-center face zones versus the center. Lower means more consistent spin.
The reason SDEI matters more than people give it credit for is that spin doesn’t just affect distance, it changes the shape of the shot in flight. A driver that throws an extra 400 rpm on every heel miss is a driver that turns those misses into balloon shots that come up short on a windy day. That’s a more annoying outcome for most golfers than losing five yards of carry, and it’s the part of the game robotic data is uniquely good at quantifying.
By that lens, the gap between the G440 Max and the G400 lineup isn’t subtle. The 2025 head holds spin within 230 rpm of its center baseline across the face. The G400 sits at 317, the G400 Max at 342, meaningful enough that a tour-level fitter could probably feel the difference on a launch monitor in a quiet bay.
The G440 K’s reading (243) lands almost exactly where the standard G440 Max does, which is the answer most golfers will want from a moveable-weight chassis: a different shot shape on demand without giving up spin consistency to get there.
Dispersion observations 95% Dispersion — 4 Drivers 95% Dispersion Area and Lateral Width Area = total field your shots scatter across. Lateral width = how far left-to-right the pattern runs. Both are 95% confidence statistics across all 54 shots. The K wins on lateral width; the G440 Max wins on overall area. 95% Dispersion Area (sq ft) · smaller = tighter overall scatter G440 Max2025 · 2025 Lineup 525.8SQ FT G400 Max2017 · 2017 Lineup 821.1SQ FT G4002017 · 2017 Lineup 863.4SQ FT G440 K2025 · 2025 Lineup 882.8SQ FT 95% Lateral Width (yds) · narrower = tighter side-to-side spread G440 K2025 · 2025 Lineup 29.4YDS G440 Max2025 · 2025 Lineup 31.4YDS G400 Max2017 · 2017 Lineup 35.7YDS G4002017 · 2017 Lineup 44.1YDS
If there’s a single section of this analysis where the case for upgrading from a G400 to a current head writes itself, this is it. Dispersion is the metric that captures everything the face heat map and SDEI hint at—face technology, CG placement, spin behavior, mass distribution—and rolls it into a single answer to the question every fitter eventually has to ask: how many fairways hit do you give up to play this driver?
The G400 gives up a lot of fairway. Its 95% dispersion area runs 64 percent larger than the G440 Max’s, and its lateral spread—the metric that actually predicts whether a missed drive ends up in the short grass or the rough—is 14.7 yards wider than the G440 K’s. That’s practically an entire fairway’s worth of additional miss room, on the same swing. The G400 Max trims the gap meaningfully but doesn’t close it.
Something worth flagging within the 2025 lineup: the G440 K has the narrowest lateral spread of any head in the test (29.4 yards) but a larger overall dispersion area than the standard G440 Max; its shots scatter narrower side-to-side but spread further downrange. That’s a different kind of forgiveness than the G440 Max delivers, and the right fit depends on whether a player’s miss tendency is lateral or distance-based.
What the robot data tells us 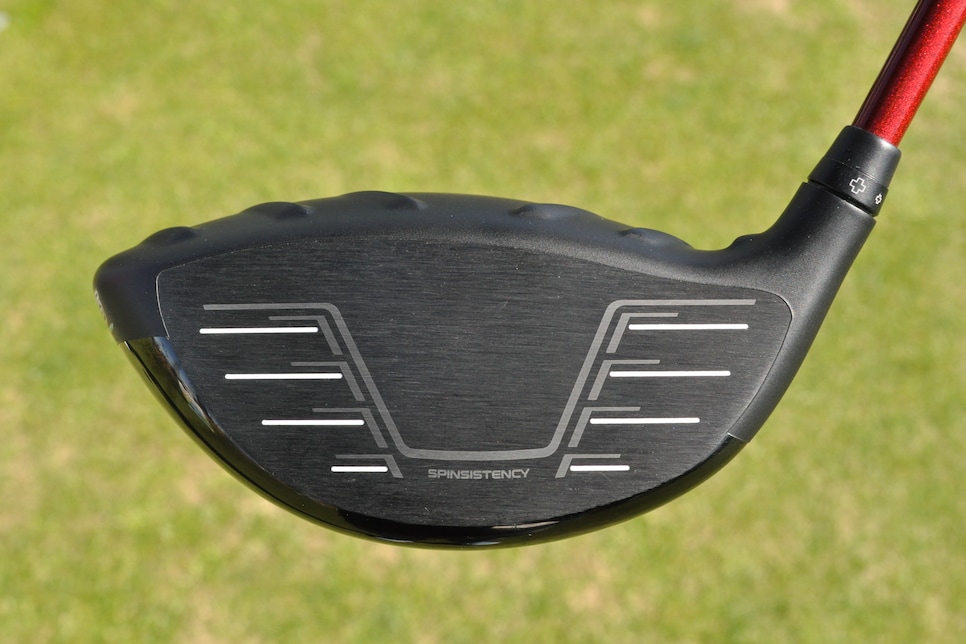
The G400 lineup’s longevity in tour bags and aftermarket channels isn’t an accident, and the robot data doesn’t argue otherwise. Both heads still produce competitive ball speed. Both hold their carry on a center hit. The G400 Max specifically lands within four yards of a brand-new G440 Max when impact is square, which is the version of the driver that produced its reputation in the first place. None of that has changed.
What’s changed is what the rest of the lineup looks like in 2025. Ping’s newest heads aren’t dramatically faster or longer than the G400s on a clean strike—the headline gains are real but modest.
The gains are in the part of the dataset most golfers can’t see without a robot: spin behavior across the face, dispersion and mishit protection. A player still hitting a G400 isn’t playing a bad driver. They’re playing a driver that asks more of them on the swings that aren’t perfect.
The G400 lineup’s place in driver history isn’t really in dispute. It’s one of the few offerings that’s still being embraced nine years after launch, and pieces like this one exist because the lineup earned that staying power. What the robot data adds isn’t a verdict on whether the G400 is a good driver. It’s a measurement of how much the rest of the category has moved while the G400 stayed where it was.
This article was originally published on golfdigest.com