Let me issue an emphatic disclaimer up top: I love the US PGA Tour’s “Strokes Gained” metrics, and I’ve loved them for years. As the statistical brain child of Columbia University professor Mark Broadie, it represents professional golf’s first meaningful foray into advanced metrics, and it’s already revolutionised how some of us think about the sport. I’m about to nitpick about one particular facet of how it’s used on tour, but before I do, I want to make it clear that Broadie’s work has been immensely valuable to golf, and I genuinely wish the tour had implemented the system earlier and more comprehensively.
So, what is Strokes Gained? First implemented in 2011 and now back-dated to 2004, it’s a unified method of measuring an individual golfer against the tour average. Using a treasure trove of ShotLink data amassed over the years, it’s possible to determine exactly how many strokes the fictional “average PGA Tour golfer” requires to put the ball in the hole in a given situation. Putting from 20 feet? Thousands and thousands of real-life examples tell us that it requires an average of 1.874 strokes. Hitting a 140-yard approach from the fairway? 2.89 strokes. Two hundred yards away and in the rough? That’s 3.39 strokes. On the tee, 519 yards away? It’s 4.5 strokes.
You get the idea. Strokes gained, then, measures how much better or worse any real player performs compared to these averages, with adjustments for how the field performs in the specific event being measured. Since the norm for a 20-foot putt is 1.874 strokes, the strokes gained score for a player who sinks a 20-footer is +.874 – he beat the average by that amount – while a player who two-putts from that distance receives a score of -0.126. Over the course of a round, a tournament and a season, these numbers add up to an overall strokes gained score and give us a comprehensive picture of a golfer’s skill. Even more usefully, they can be broken down by shot type – Strokes Gained: Off The Tee, Strokes Gained: Tee To Green, Strokes Gained: On The Approach, Strokes Gained: Around The Green and Strokes Gained: Putting.
The accumulated data gives fans a new kind of insight into a sport that was mired in near-useless (and often misleading) statistics for its entire history. It’s also a gold mine for players. Now, more than ever before, a US Tour golfer can see precisely where he excels, and where he needs to improve, with a high degree of specificity. Someone who sits in the top-10 in making putts inside 10 feet might struggle outside 30 feet, and that kind of knowledge can be invaluable when deciding how to practise.
A quick look at 2017’s stats provides some excellent examples. Take Hideki Matsuyama, who was one of the best players in the game from tee to green, with a Strokes Gained average of 1.369 per round, ranking him fifth overall. In terms of putting, though, he was a disaster, finishing 173rd (of 190 players) with an average of -.383. Kyle Stanley had a similar imbalance, finishing 11th from tee to green (1.259) and 159th in putting (-.309). Michael Thompson, on the other hand, was the best putter in the game last year (+.840), but finished a dismal 183rd from tee to green (-1.013).
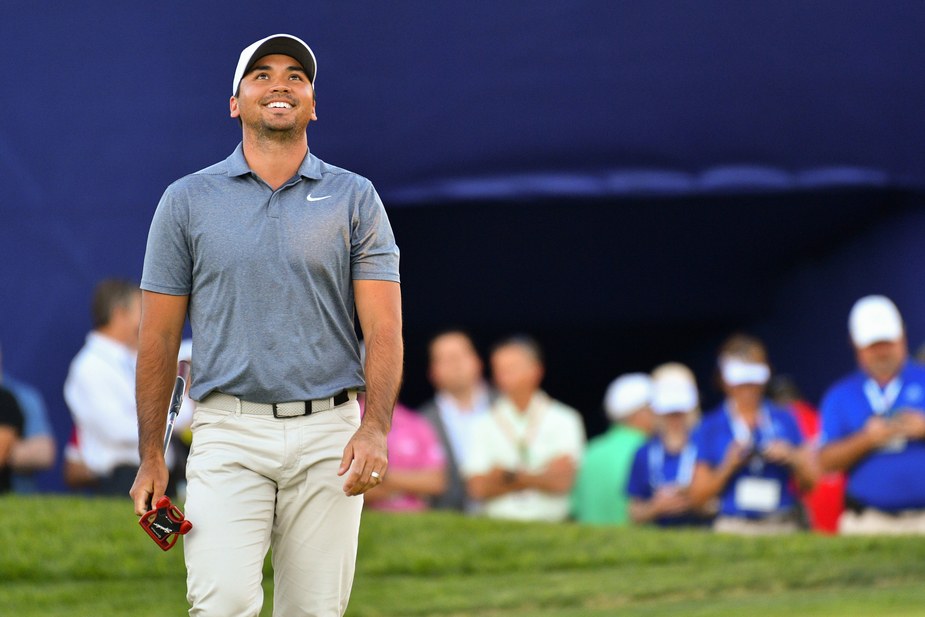
It’s also a wonderful metric by which to judge true excellence. Since the stats were first kept in 2004, Jason Day is the only player to average more than a full stroke gained in putting for an entire season. It happened in 2016, when he rose to No.1 on the world ranking. Meanwhile, there is a very short list of players who have managed to gain more than a stroke per round off the tee for an entire year: Dustin Johnson, Rory McIlroy, Bubba Watson and Sergio Garcia. The story checks, does it not? If you’re feeling particularly cruel, you can also sort for ineptitude – Boo Weekley is the only player to lose more than one stroke putting per round for three entire seasons, a ‘feat’ he ‘accomplished’ in 2011, 2012, and 2014.
And now that I’ve praised strokes gained to death, it’s time for the “but”. It’s a settled question that the statistic is useful and illuminating when looked at in hindsight, but I’ve been asking myself another question lately: is it really that good in the middle of a season? Or are the sample sizes too small and too variable?
Let’s look at 2018. We are currently past the halfway point in the US PGA Tour’s wrap-around season, and Day currently leads the strokes gained: putting category with an average of 1.414 per round. We know he’s having a great year, and we know he’s putting the lights out, but this is something else entirely. If he finished at that number, it would demolish the previous record that he himself set. Impressive stuff… except when you look at the stats, another number leaps out: measured rounds. For Day, that total is 17.
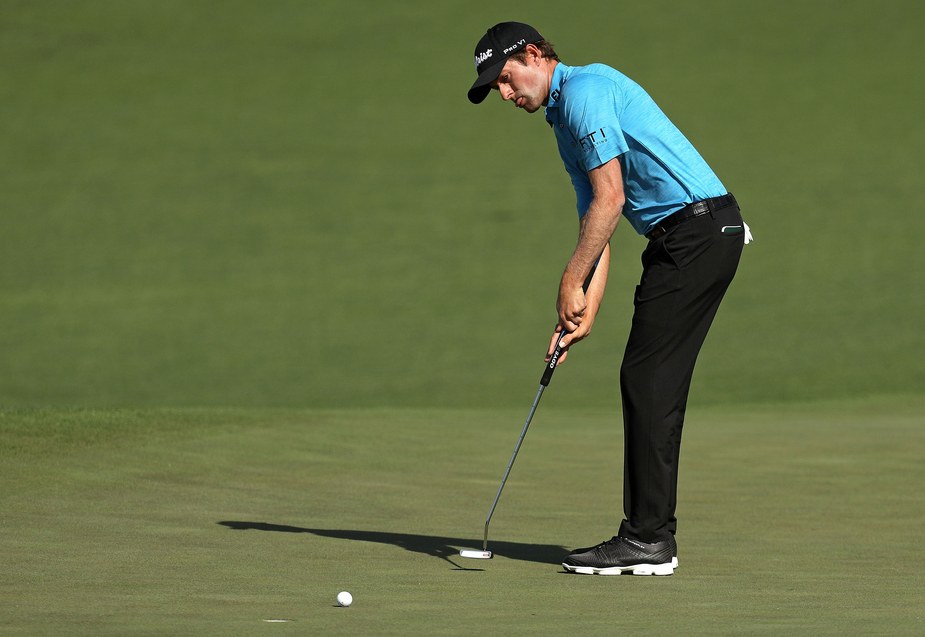
Even as an extremely amateur stat geek, 17 strikes me as a huge red flag. Day’s place atop the rankings has been mentioned quite a bit this year, on TV and elsewhere, but 17 rounds to base that on simply isn’t a large enough sample. Think about it – Day is averaging 28 putts per round, which means that his SG number is based on fewer than 500 putts. That may sound like a lot, but a glance at his closest competitors reveals a significant disparity. Phil Mickelson (also on pace to break the overall record) has 32 rounds measured. Webb Simpson, in fifth, has 41, and ninth-place Peter Malnati has 43. Meanwhile, Kiradech Aphibarnrat (seventh) has just 14, and Branden Grace has 18.
Those are some serious discrepancies, and it raises a tough question: are these averages really comparable? Or is someone like Day, with fewer rounds, destined for a correction? Is Mickelson’s number necessarily more legitimate because it’s backed up by more data, and if so, should writers and announcers really be touting any strokes gained rankings in the middle of a season?
But in golf, that’s what we’re doing within a single year. Day has 17 measured rounds, and we’re comparing him to players with two times the sample size – and in some cases almost three. Looking back to last season, Thompson, the strokes gained: putting champ, finished with 44 measured rounds, while Brian Harman landed in fifth with 86. Can we say with any certainty that Thompson wouldn’t have regressed to the mean with more rounds under his belt? Is his average of .840 really more impressive than Harman’s .542, when you consider the volume?
There’s also this: Day has played 39 rounds this year, but only 17 have been measured. (ShotLink did not measure Strokes Gained at the CJ Nine Bridges, the WGC–HSBC Champions, the WGC–Dell Match Play, the Masters or the Zurich Classic team event.) What if the sample isn’t representative? What if those 17 disproportionately represent his very best? Over 1,000 rounds, the irregularities would even out, but over 39, it’s entirely possible to have significant distortion.
I spoke with Broadie about the issue, and he raised the excellent point that this is not a Strokes Gained issue, but rather a professional golf issue. The questions on sample size are just as true for any golf statistic, advanced or not, and in fact his response made me feel a bit ungrateful for asking the question.
Golf is unique in that players have a choice in how often they play, which leads to certain comparative anomalies, and some tournaments don’t lend themselves to measurement – events like Pebble Beach with multiple courses tend to have measurements at just one course. Strokes Gained as a stat has no control over those elements.
But it’s not quite independent of them, either – those factors influence the efficacy of the stat, especially within a single season, and Broadie recognised that.
“Someone like Phil [Mickelson], with 32 rounds measured, you wouldn’t expect as much change or regression to the mean as you would from Jason Day,” Broadie said. “With Day, if I had to predict where he’d be at the end of the season, I’d still predict way up there, probably No.1, but not as high as these 17 rounds would indicate.”
It would be possible, he told me, to adjust for expected outcomes in order to remove these disparities, but that would raise its own set of problems.
“The number of rounds isn’t taken into account,” Broadie said, “and I think that’s because any way that some analytics person or statistician could adjust, people would say, ‘That’s not fair. Those adjustments didn’t actually happen. You’re applying maths where it doesn’t actually belong.’ Where the rounds that you measured really shows what happened. There’s a trade-off, and I don’t think there’s an easy solution that would make everyone happy.”
And that’s another problem – there are infinite tweaks you could make to Strokes Gained, but it would make a concept that is already advanced by golf standards even more difficult to explain. The abstraction would present too high a hurdle, and Broadie’s right that the current system, warts and all, is superior.
Later in our conversation, I put the question to him more bluntly: considering the occasionally small, always variable sample sizes between players, how valid are the strokes gained rankings?
“The way most fans think about it, it’s a fair ranking of what happened,” he said. “On the other hand, if you want to place a bet today on what Jason Day’s end-of-season strokes gained: putting numbers will be, I would have less faith that his current number would be the same than I would for Webb Simpson. I don’t think the numbers are compromised, but I think how you want to interpret it and use it, that’s where the number of measured rounds has a big impact.”
A careful answer, but a fair one. In the end, we can hope for a few things: that Strokes Gained becomes more widespread, that the US PGA Tour implements even more measured rounds each year (and that Augusta National comes on board and allows the measurement to be made public at the Masters), and that someday we can look at both the actual results and some sort of adjustment that tries to account for the difference in sample size. Until then, our best bet is to appreciate Strokes Gained for the great leap forward that it represents in golf analytics, and remember to keep one eye on context.